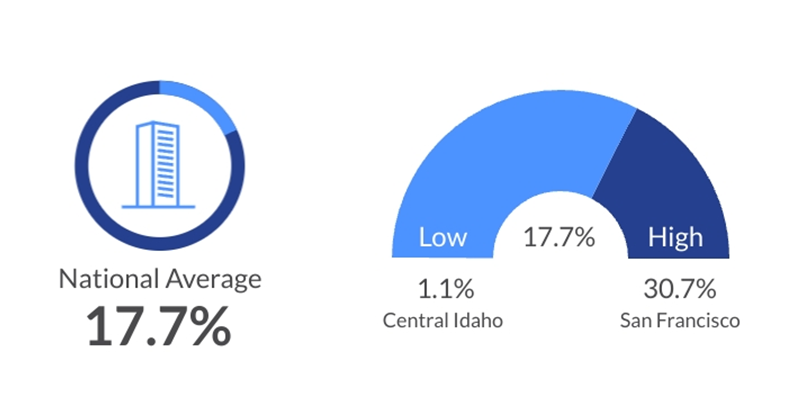
Limited new construction resulted in a lower quarterly increase in vacancy. The Q3 national rate was up 10 basis points from last quarter to 17.7%.
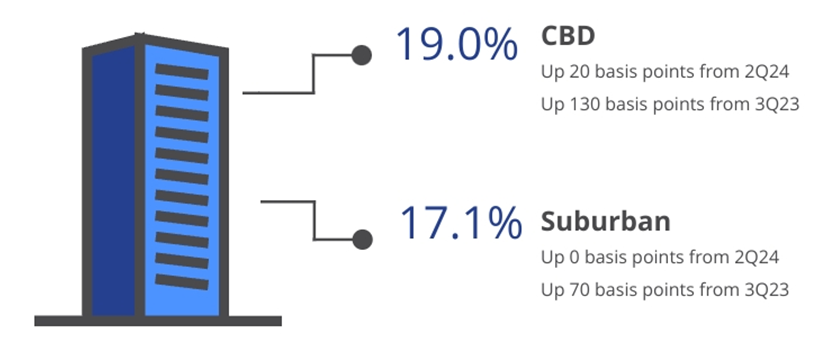
CBD vs. Suburban Vacancy
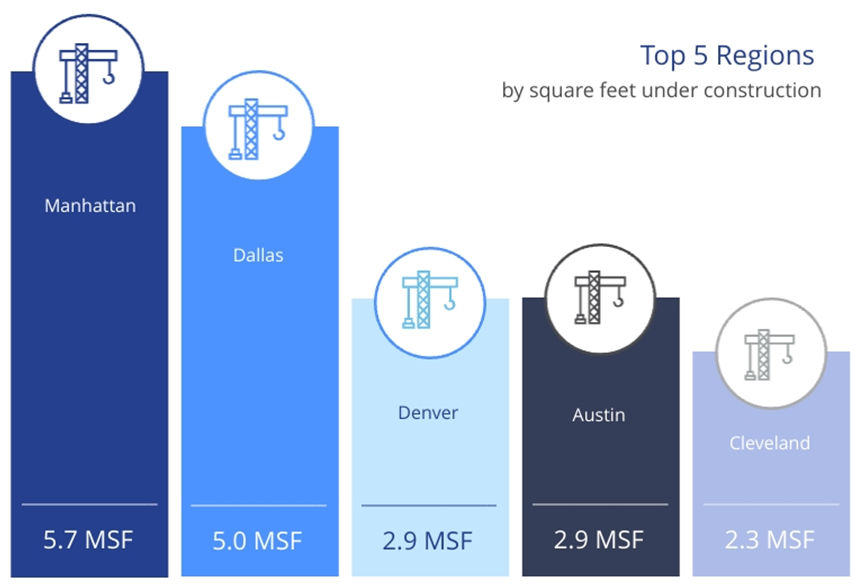
Office Under Construction
50.3 Million Square Feet
Construction pricing and uncertainty in prolonged tenant demand have limited new construction starts. As of the end of Q3, only 50.3 million SF were under construction, while 7.8 million SF was completed.
Source: Colliers National Office Research